There is now a Crap4J plugin for the Hudson continuous integration server, thanks to Daniel Lindner.
For those of you unfamiliar with Crap4J, it is a metric that "combines cyclomatic complexity and code coverage from automated tests to help you identify code that might be particularly difficult to understand, test, or maintain".
The Hudson Crap4J plugin maintains "Crappyness Trends", which is a feature missing from the standard Crap4J reports. It also shows details of any methods that exceed the crap threshold.
In order to use the plugin, you must first download the Crap4J Ant task and integrate it into your Ant build file. If you're running Windows, this is where you're likely to run into a road-block. On Windows, a bug stops the Ant task from figuring out the Crap4J home. The workaround is to set the ANT_OPTS environment variable:
set ANT_OPTS="-DCRAP4J_HOME=c:\java\tools\crap4j-ant", where c:\java\tools\crap4j-ant is the location of your Crap4J ant tasks.
Once your Ant build is producing the Crap reports, you're ready to integrate it into Hudson.

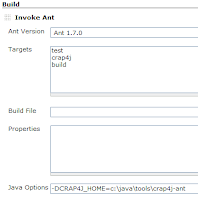
After downloading and installing the plugin, you'll need to add the Ant target that is running the Crap4J task. In the example, I've set up a crap4j target.
Then, on Windows, you'll need to add the Ant options to detect the Crap4J home. Click on the "Advanced..." button in the Build section. In the Java Options, enter
-DCRAP4J_HOME=c:\java\tools\crap4j-ant, where c:\java\tools\crap4j-ant is the location of your Crap4J ant tasks.
Then, in the Post-build Actions section, specify the location of
 the output from your Crap4J ant task.
The next time Hudson runs your build, look for the toilet roll on the left of the dashboard for your Crap details.
A few comments on the current plugin (currently at v0.2):
- It would be great to be able to adjust the CRAP threshold. The default threshold of 30 is really too high for new code, and I typically set it to 15.
- I'd also love to be able to view the complexity, coverage and CRAP scores for all methods, not just the scores for the methods over the CRAP threshold.
- When the crap method percentage is less than 1, the Crappyness Trend chart does not show any %age figures on the scale.


No comments:
Post a Comment